

Summary
We are approaching a death cross — the 50-day moving average is slipping below the 200-day. Here are the levels we are watching on the downside.
Market Recap
Market Movers
- 📈 US RETAIL SALES: Apr 16, 2025
📚 Deep Dive 📚
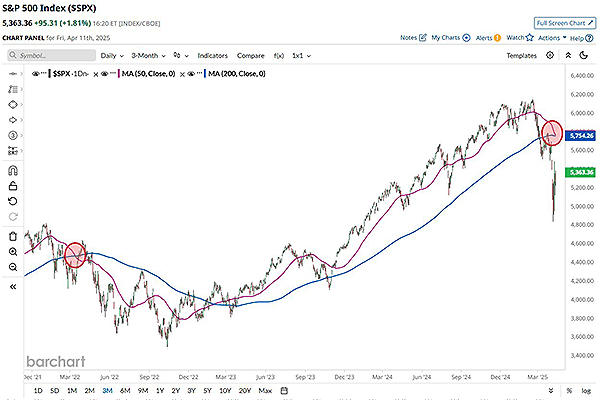
📊 S&P 500 Spot Index Breakdown – April 2025 $SPX Let’s assess key price levels, historical context, and what’s ahead. Chart shown is the montly candle chart to show the years
 ⚠️ Death Cross Warning
• We are approaching a death cross — the 50-day moving average is slipping below the 200-day.
• 📉 Last occurrence: March 17, 2022
🔻 Market bottomed in October 2022
📈 Highs not reclaimed until January 2024
• That drawdown?
From 4810 → 3500 = –27%
⸻
📉 If History Repeats:
• Current peak: 6147
• A –27% drawdown would bring us to target: 4488
🟡 That’s just beneath the long-term trendline from the COVID lows — critical support zone
⸻
📌 Downside Key Levels to Watch:
• 4800 – Bounce zone & 2025 lows
• 4662 – Long-term trendline support (COVID bottom extension)
• 3500 – Major support & 2022 low
‼️ (3500 would be a –43% drawdown — worse than the COVID crash (-36%) Unlikely unless we enter a deep recession)
⸻
🧠 Bottom Line:
• The death cross is a bearish signal — be cautious.
• 📍 Watch 4800 and 4662 as major levels of support.
• If the market mirrors 2022 behavior, 4500 is your realistic downside target.
• 3500 is the line in the sand if things unravel severely. massive buy zone!! 🚨
⸻
🌐 Macro Notes:
• Market action still sensitive to trade headlines, tweets, and negotiations.
• No trade deals + elevated tariffs = pressure remains.
• But… If tariffs are lifted or deals are made → we could rocket higher fast.
Either way--We will be ready!
Lock in our Discord for the next trade alert. Trade decisively, happy hunting.